Analyst Dashboard
This section explains each widget in the Analyst Dashboard.
Questionnaires
This widget helps you easily understand your risk from questionnaires, with a link to open the questionnaire platform. If you did not subscribe to the questionnaire function, this widget shows what it can do for you.
Findings In Remediation
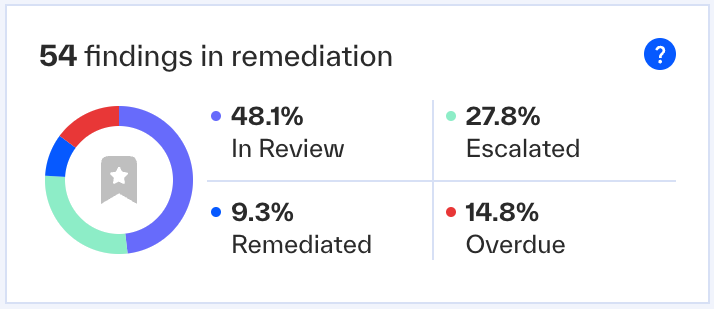 |
This widget helps you easily understand the status of escalated findings. It shows escalated findings in groups.
In Review - The ROC is in the process of investigation for accurate and correct information.
Escalated - The ROC has high confidence the findings are correct and escalated to you for remediation.
Remediated - The supplier resolved the findings, or you accepted the risk.
Overdue – The ROC escalated findings to you, but you did not respond.
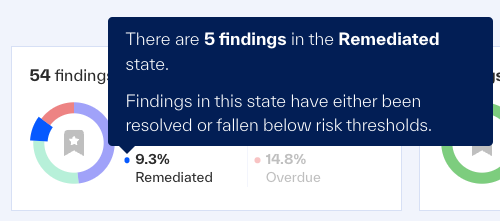 |
To see the total findings of the group and the group definition, hover over a data element.
To open Findings, filtered by escalation status, click a data element.
To see all escalated findings, click the widget (in a point that is not a data element).
Findings By Severity
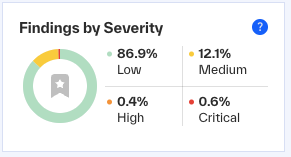 |
This widget helps you understand how risks spread for all findings that BlueVoyantBlueVoyant detected on the suppliers you monitor.
Low
Medium
High
Critical
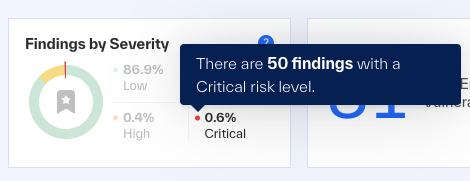 |
To see the total findings of a risk level, hover over the risk level data element.
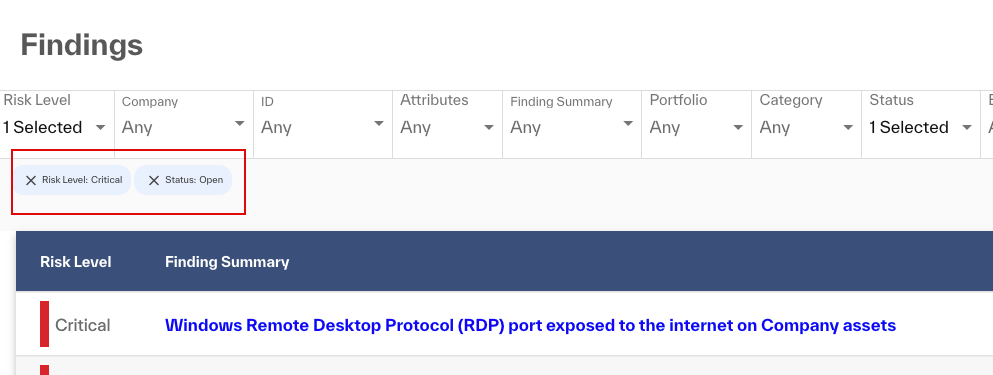 |
To see Findings filtered by risk level, click the risk level data element.
To see findings of all risk levels, click the widget (in a point that is not a data element).
Total Emerging Vulnerabilities
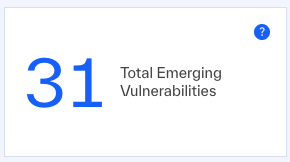 |
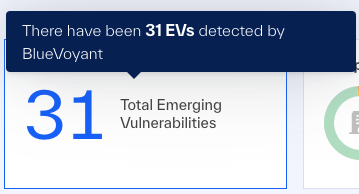
This widget shows how many emerging vulnerabilities (EVs) were detected in your monitored companies, published and investigated by BlueVoyant.
 |
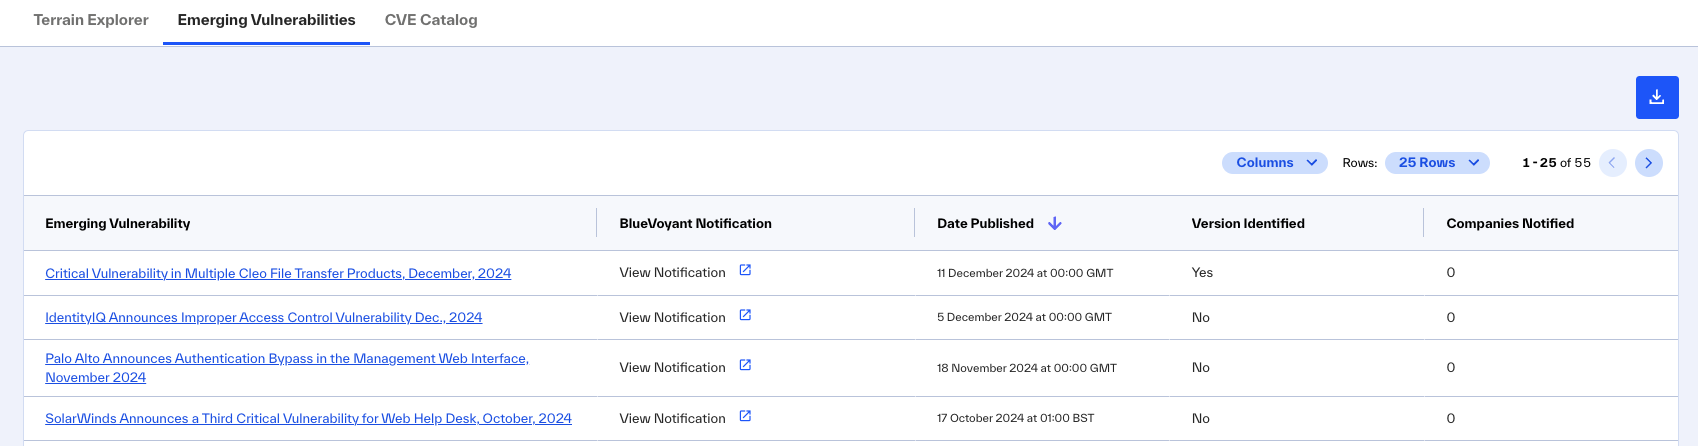 |
To open Emerging Vulnerabilities, click the widget.
Company Scores
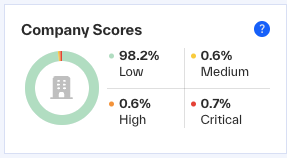 |
This widget helps you understand the how risk spreads through the companies you monitor. The risk level for a company is calculated from their total score.
Low
Medium
High
Critical
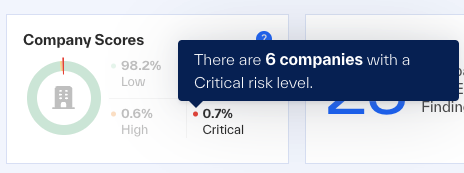 |
To see the total companies in each risk level, hover over a data element.
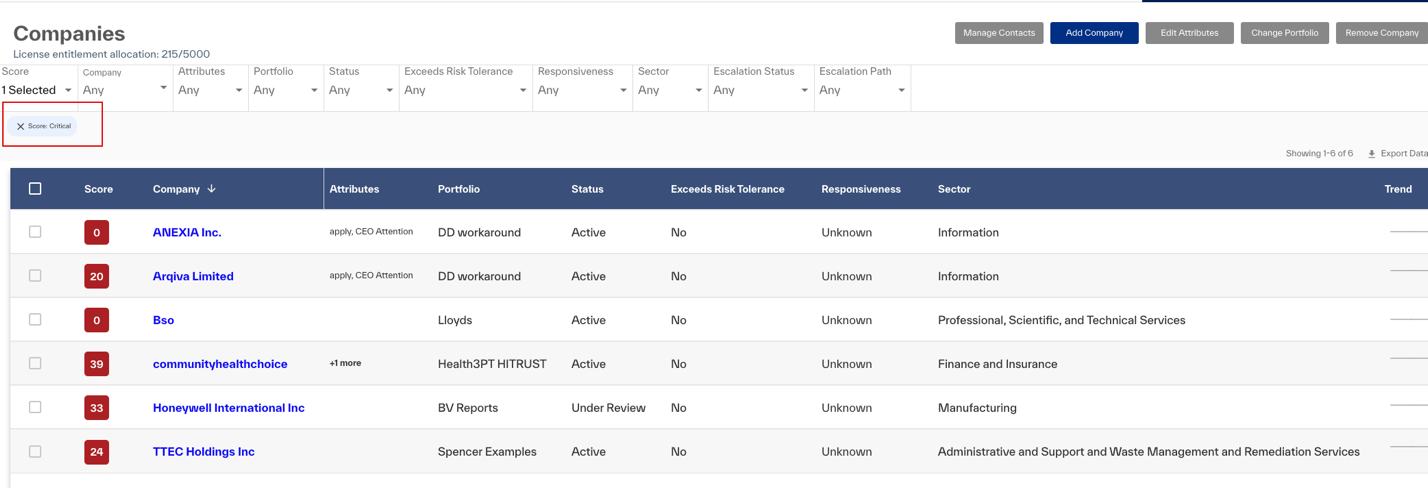 |
To open Companies, filtered by a selected risk level, click the risk level data element.
To see all companies of all risk levels, click the widget (in a point that is not a data element).
Companies with Escalated Findings
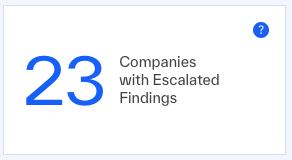 |
This widget shows the total companies that you monitor that have one or more escalated findings.
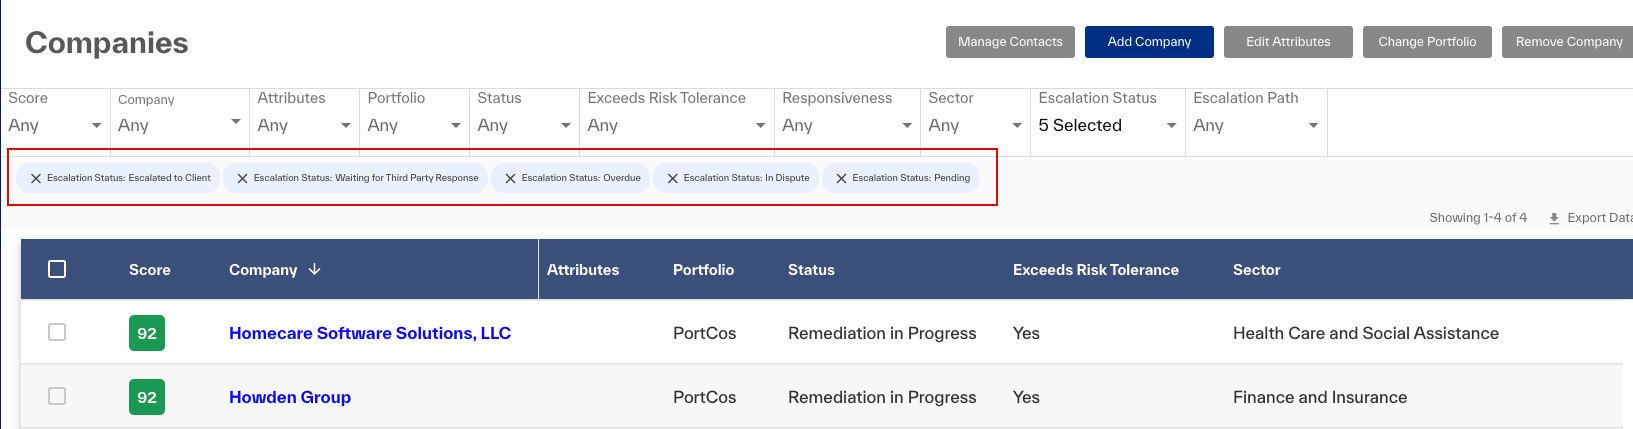 |
To open Companies, filtered for those with escalated findings, click the widget.
Escalated Findings – Remediation Performance
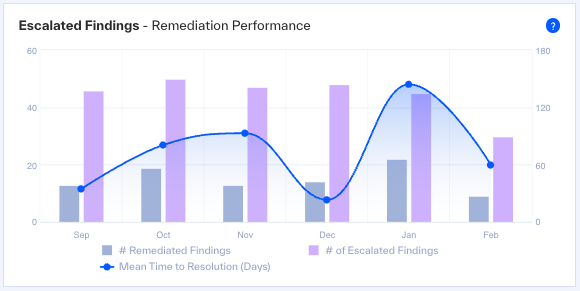 |
This widget shows you by month: the total escalated findings, resolved escalated findings, and the mean time to remediation. The totals are calculated from the sum of escalated findings that were closed for a given month. The mean time to resolution for a given month is calculated from the average of tracked time to resolve all escalated findings that were closed for that month.
These important data points help you understand the value of BlueVoyant service to enable risk remediation in your supply chain.
Note
BlueVoyant is not responsible for remediation. Our responsibility is to identify, confirm, and escalate findings.
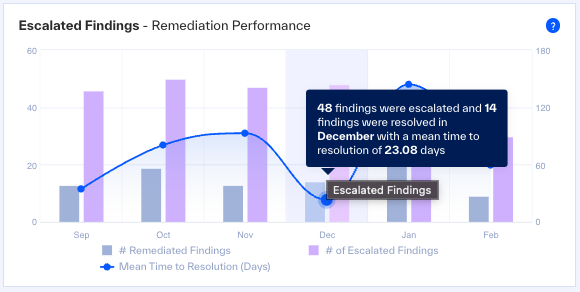 |
To see the total escalated findings and mean time to resolution for a month, hover over the month.
Emerging Vulnerability – Most Recent
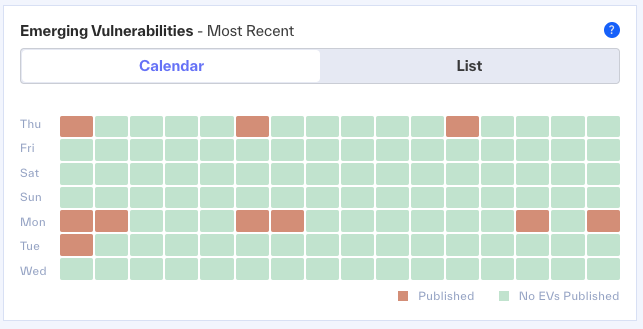
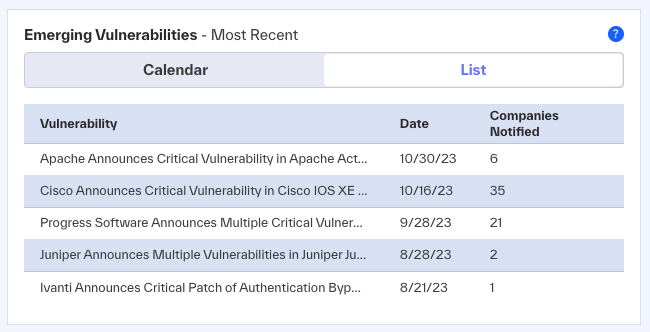
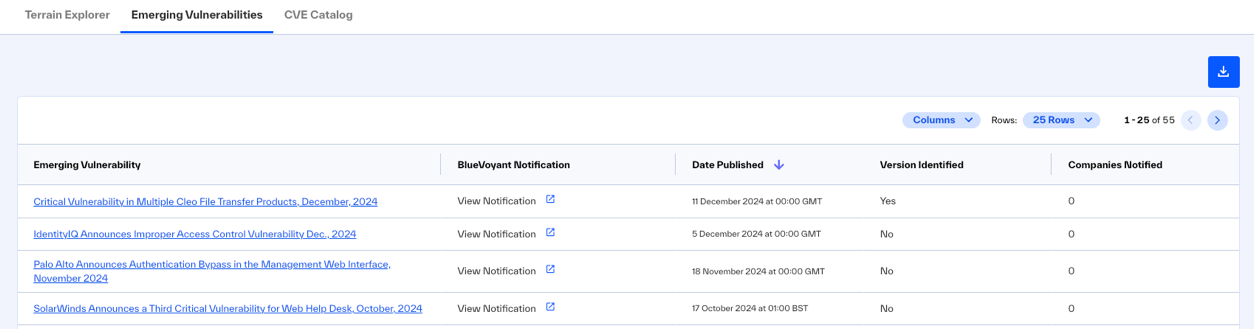
This widget lets you track the recently published emerging vulnerabilities (EVs). It shows EVs from the last four months in a calendar view and a list view.
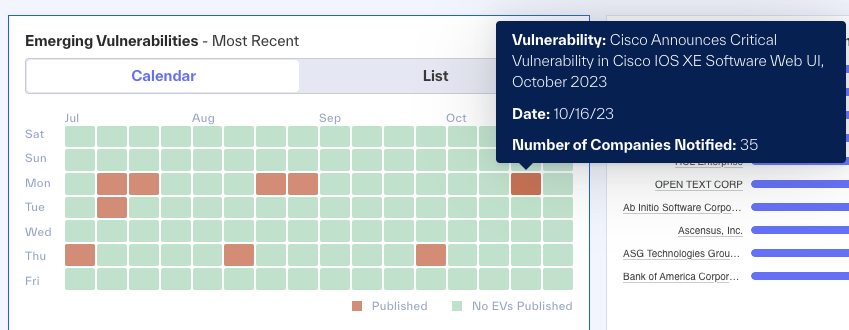 |
To see the publish data and total suppliers notified for a given EV, hover over an orange tile in the calendar view. The list view updates to show the same information in a table.
 |
To open Emerging Vulnerabilities, click the widget.
Open Escalated Findings by Company – Top 10
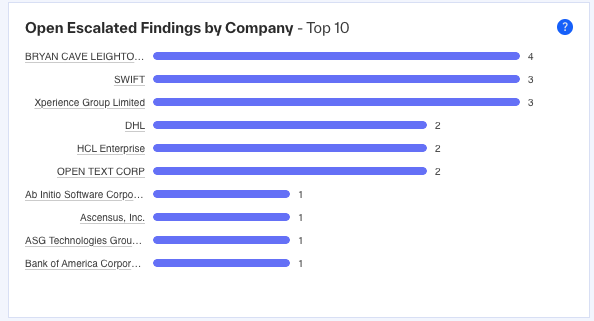 |
This widget shows which companies have the most escalated findings.
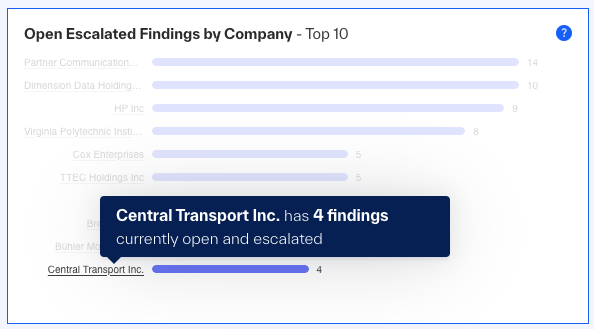 |
To see how many findings of one company are escalated and require your response, hover over the company.
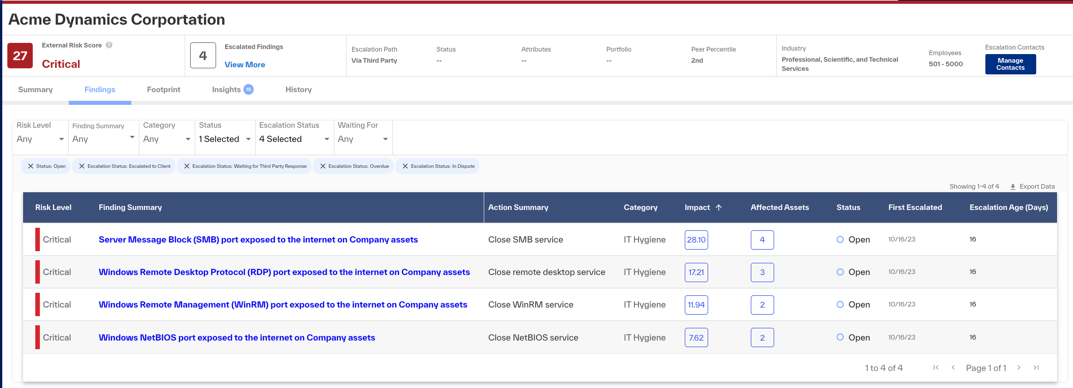 |
To open the findings of a company, filtered by escalated cases, click the company data element.
To open Companies, click the widget (in a point that is not a data element).
Escalation Engagement Path
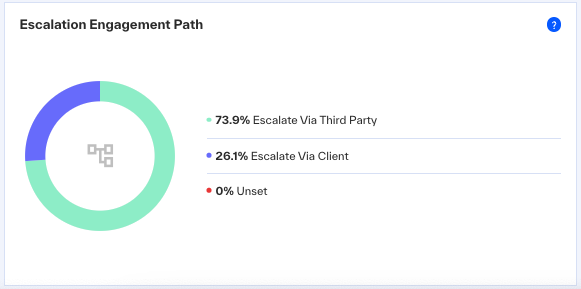 |
This widget shows the configured escalation path that the ROC uses when we escalate risk findings.
Escalate Via Third PartyE – The ROC sends escalations to the vendor or supplier
Escalate Via Client - The ROC sends escalations to you
Unset – No escalation path configured
Collaborate with your Client Success Manager to configure the escalation path. If required, BlueVoyant can help with the identification of contacts.
The Escalation Engagement Path options are the primary escalation path. The ROC will continue to send escalations to email addresses that you configure for us.
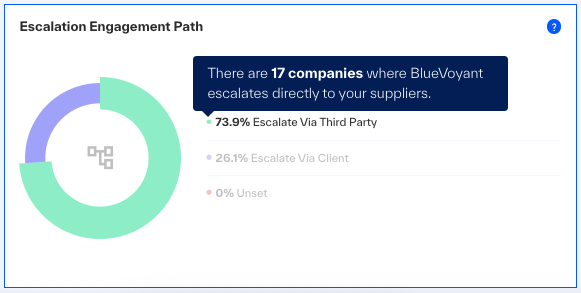 |
To see how many companies get escalation emails from an escalation engagement path, hover over the data element.
To open Companies, filtered to show the monitored companies for which we use the selected escalation engagement path, click the data element.
To see Companies without filters, click the widget (in a point that is not a data element).
Time Since Notification For Escalated Findings – Top 10
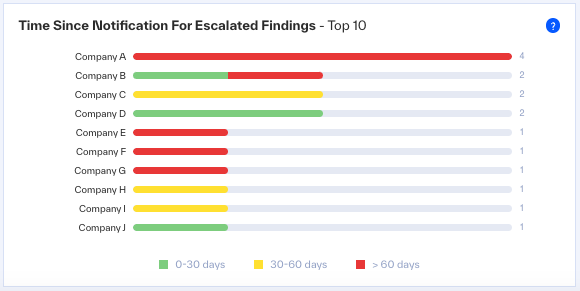 |
This widget shows which of your monitored vendors and suppliers have escalated findings open for the longest time.
0-30 days – Findings escalated 30 days ago or less
30-60 days – Findings escalated 31 to 60 days ago
More than 60 days – Findings escalated more than 60 days ago
The values in the widget let you identify companies with escalated findings that are not resolved for the longest times, and companies with more recently escalated findings.
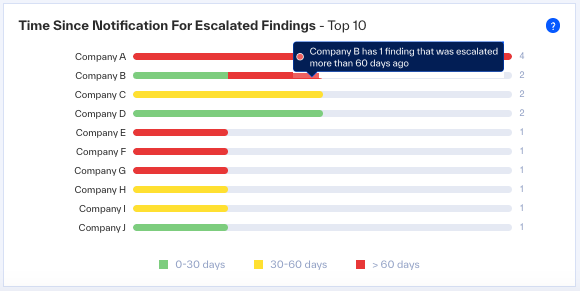 |
To see the count of escalated findings in a company of the selected time range, hover over a color in the chart.
To see the counts of escalated risk findings for each time range for a company, hover over the company name.
To open a company profile > Findings, filtered for Escalated Findings, click the company name or a color in the chart.
To open Companies, filtered for Escalated Findings, click the widget (in a point that is not a data element).
Business Risk
This widget helps you understand the business risk at this time. For the vendors and suppliers you monitor, it shows their exposure to business and operational issues.
Corporate Social Responsibility - Risks from intangible assets that may have a negative impact on long-term value and reputation of a company.
Cyber / IP - Risks with important impact on the virtual infrastructure or intellectual foundations of the business of the company.
Financial - Risks from financial changes that may have an impact on how the company can do business and invest in the future.
Foreign Influence - Risks from potential influence due to affiliation with a foreign entity of a country. The potential influence creates a business impact, even if there is no outcome.
Governance - Risks from stewardship of the supplier business by leaders or owners of the company.
Legal / Regulatory - Risks from changes in or violations of laws and regulations that impact a company or an industry.
Market / Economic - Risks from external business forces that may impact the company, including competitors and customers.
Operational - Risks that may impact the continuity of core business activities (such as weather, labor issues, materiel shortages, or other aspects important to the company).
Risk Finding Types – All Escalated Findings
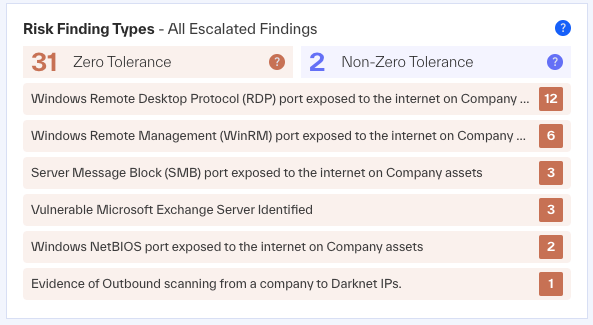 |
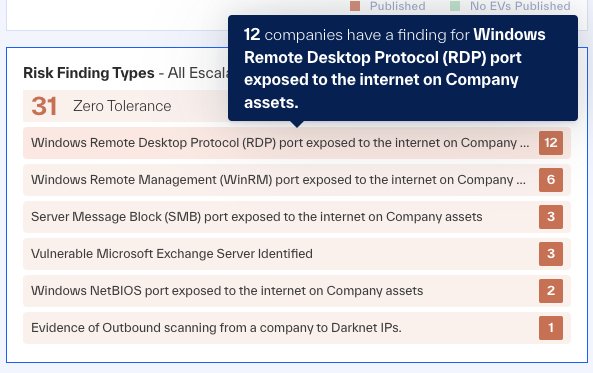
This widget shows the findings that occur frequently in the monitored companies.
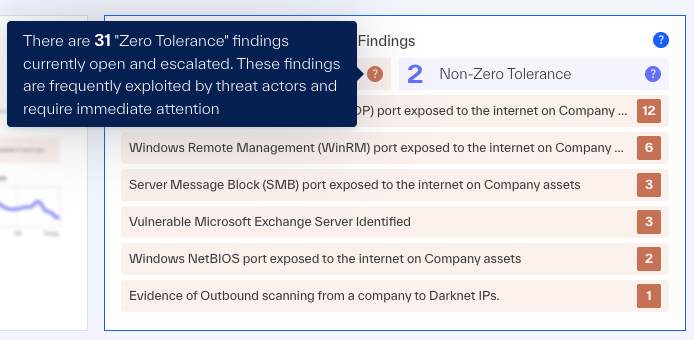
Zero Tolerance - Findings of clear policy violations (such as unauthorized access). Threat actors frequently exploit zero-tolerance vulnerabilities, and the findings require immediate response.
Non-Zero Tolerance - Flexible time to analyze risk, context, intent, and impact before you apply a response action.
The widget shows Zero-Tolerance findings first and then Non-Zero Tolerance findings. It shows how many companies have the same finding, in groups of findings from most companies to less.
 |
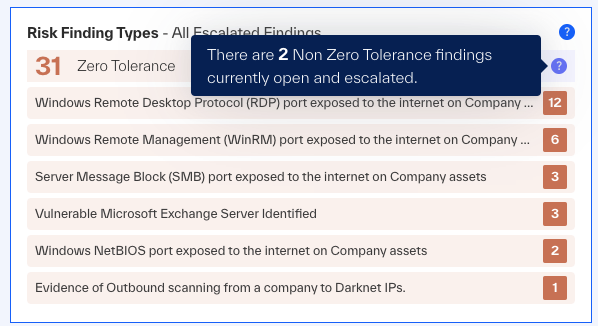 |
To see the total of Zero or Non-Zero Tolerance findings in your monitored companies, hover over the group title.
 |
 |
To open Findings for one, click the finding in the widget.
To open Findings to see them all, click in the widget (in a point that is not a data element).
Lowest Company Scores – Bottom 10
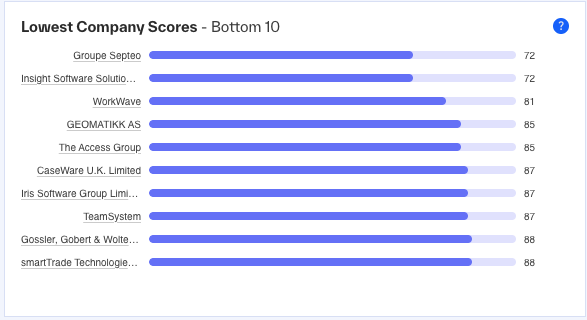 |
This widget shows which companies have the lowest scores, calculated from all the security scores.
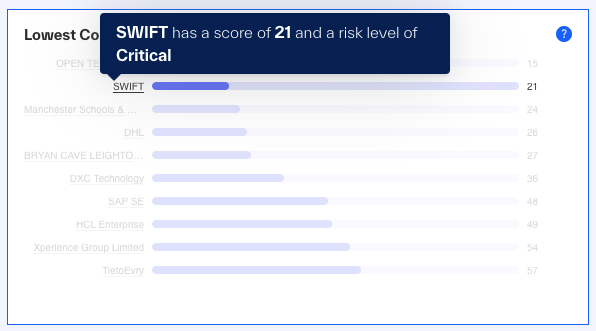 |
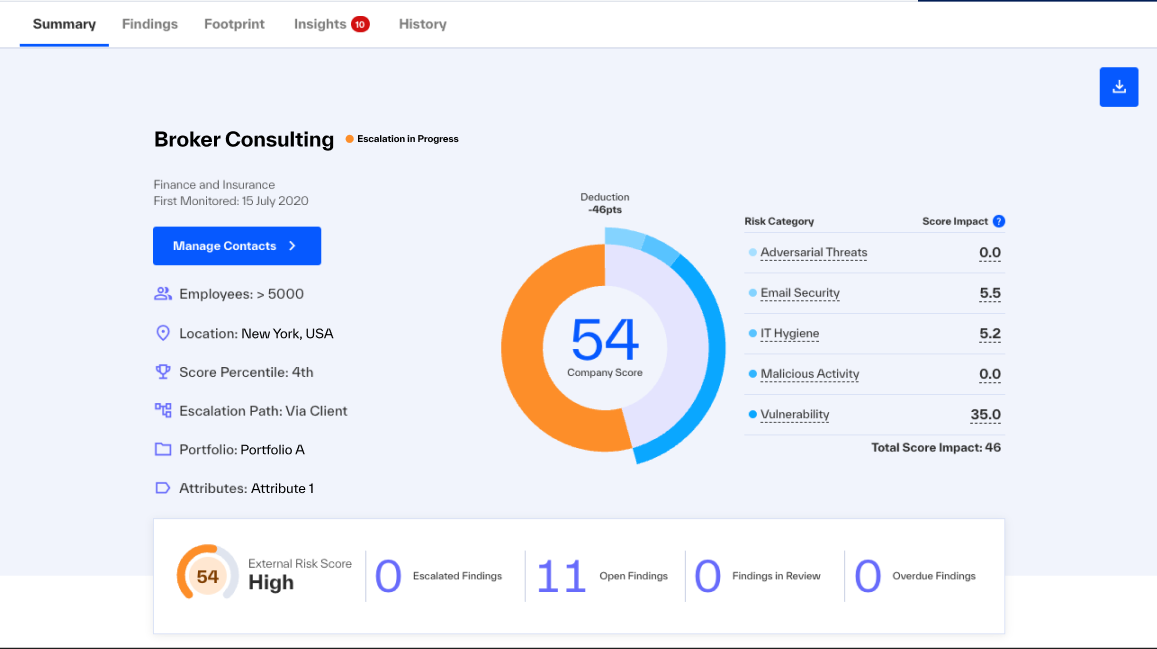
To see the company score and risk level, hover over a company name.
 |
To open Insights of a company, click the company name in the widget.
To open Companies, click in the widget (in a point that is not a data element).