Executive Dashboard
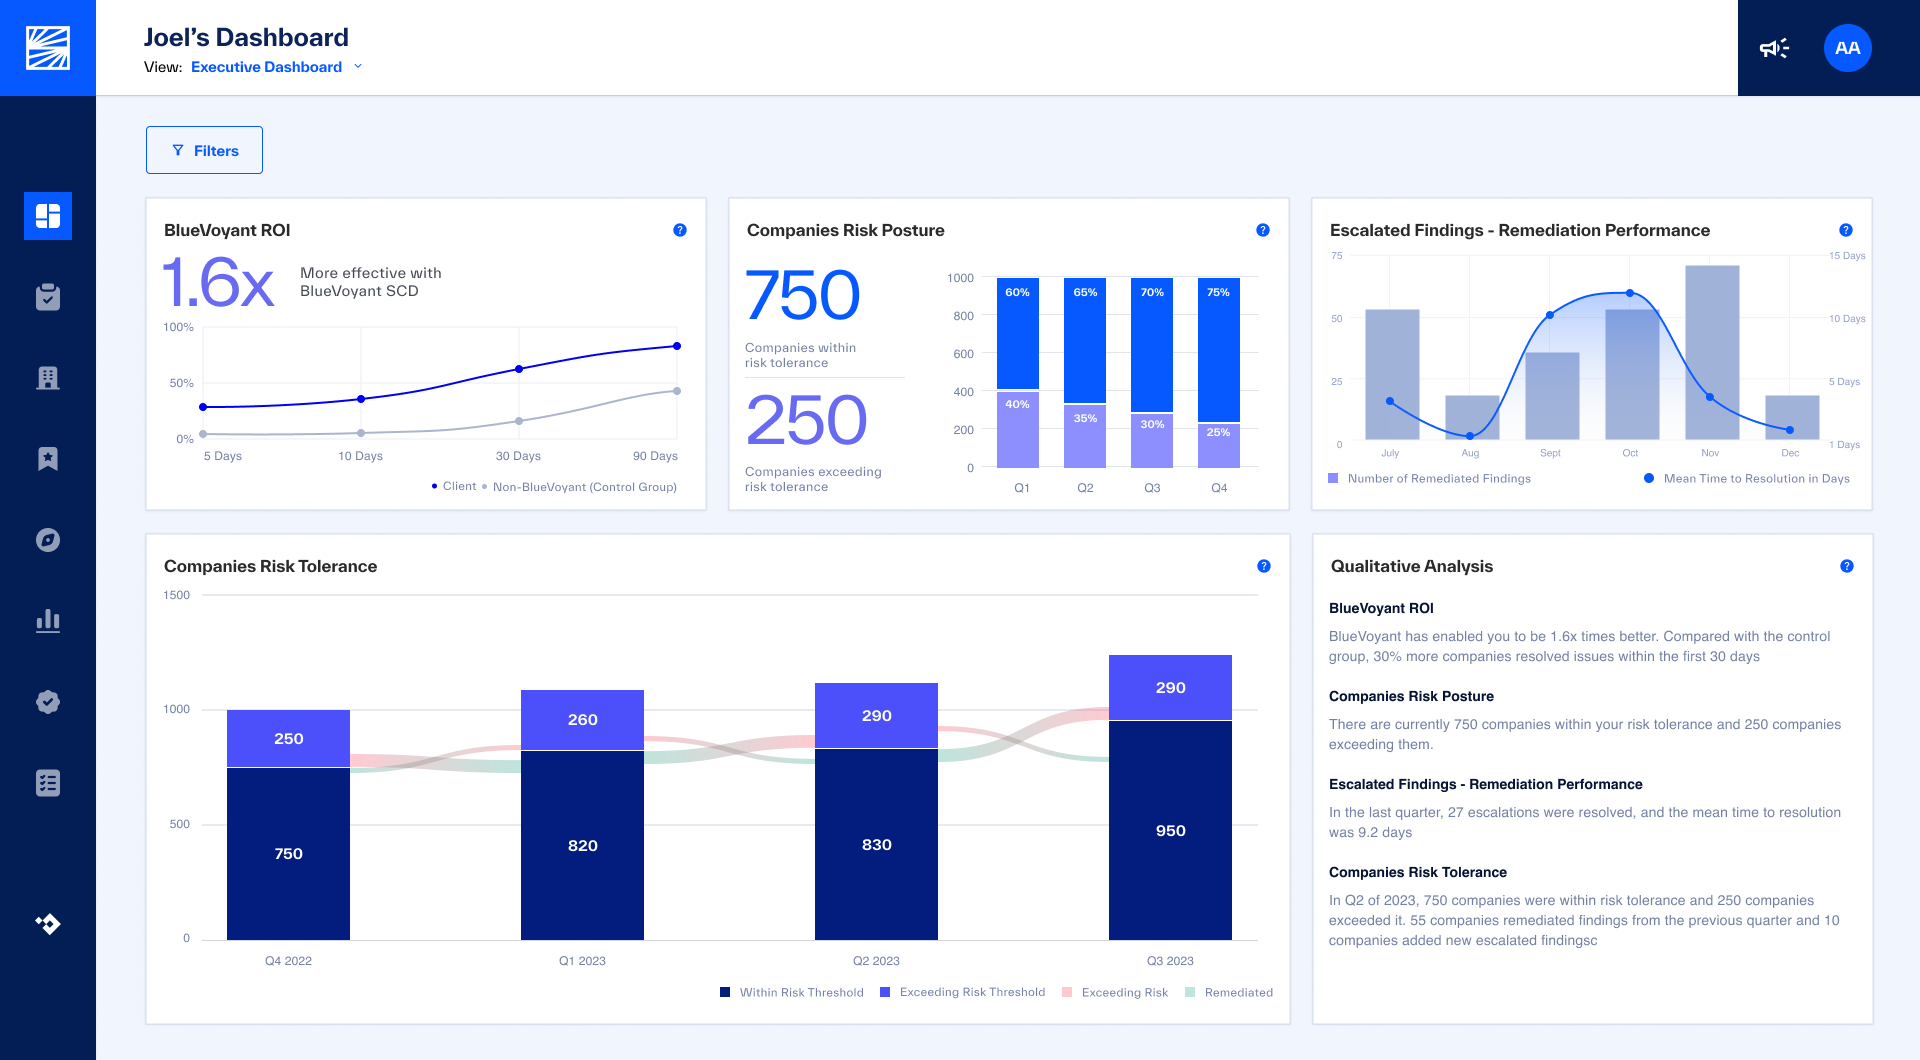 |
This section explains each widget in the Executive Dashboard.
BlueVoyant ROI
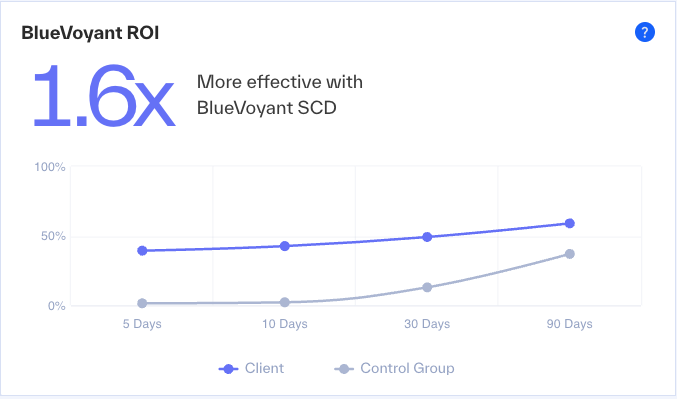 |
This widget shows the time-to-resolution metrics for escalated risk findings that were done in 5, 10, 30, or 90-days.
The Return on Investment Factor – Shows as a large N.Nx. This is how much more effective your BlueVoyant risk remediation program is compared to the Control Group.
Client and Control Group - Shows the percentage of escalated findings, to compare your (Client) time-to-resolution and the control group's time-to-resolution. The Control group is more than 1000 small, medium, and large companies in many sectors, which are continuously monitored by BlueVoyant.
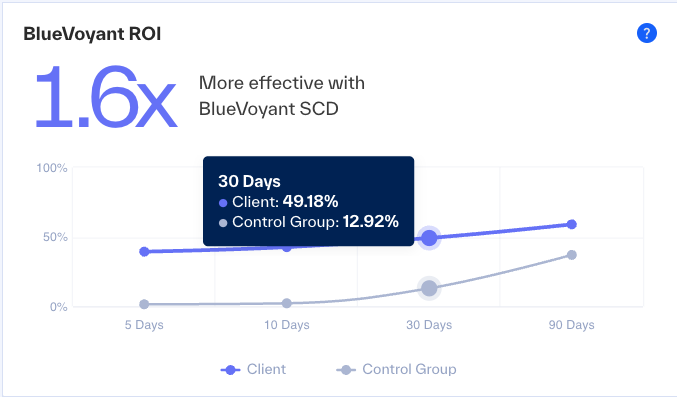 |
To see the percentages of a 5, 10, 30, or 90-day time-to-resolution for your organization for the Control Group, hover over a point in the line.
Companies Risk Posture
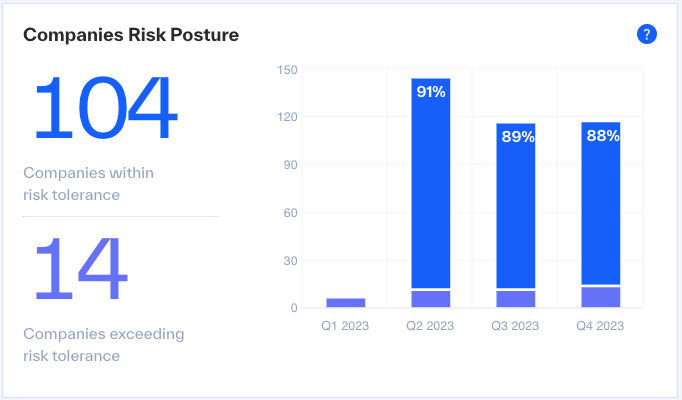 |
This widget helps you understand the change in risk posture in your supply chain for the last four quarters and where it is today. The metrics show how many companies exceed risk tolerance and how many have a risk score lower than the tolerance threshold.
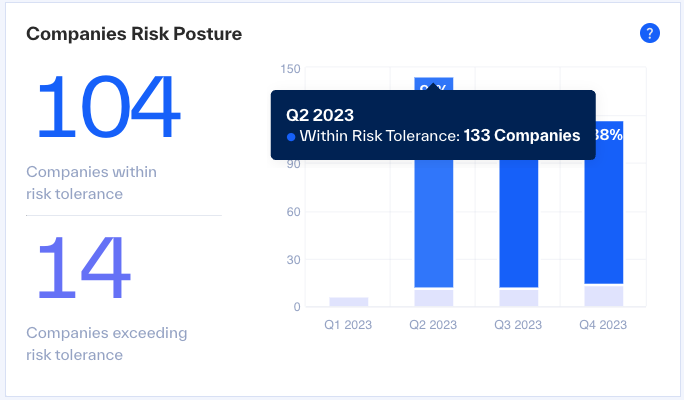
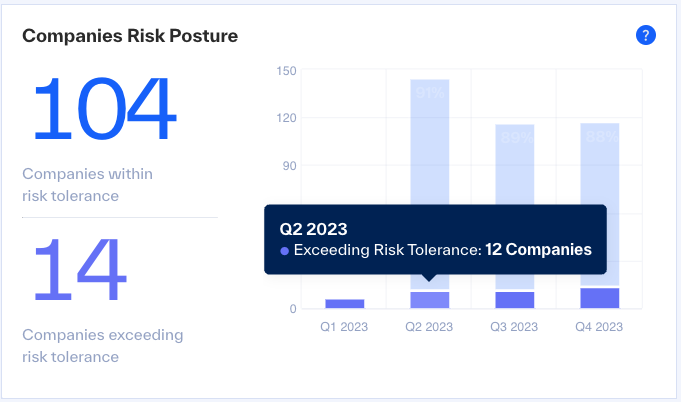
To see how many companies are in each metric for a quarter, hover over the bar.
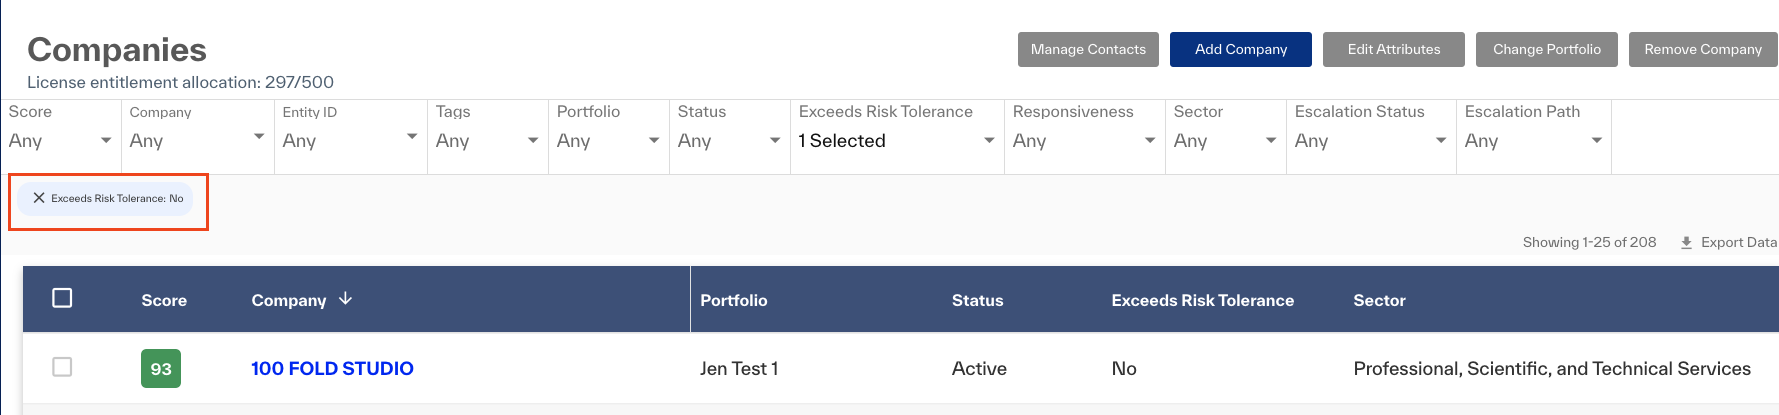 |
To open Companies, click in the widget (in a point that is not a data element).
Escalated Findings – Remediation Performance
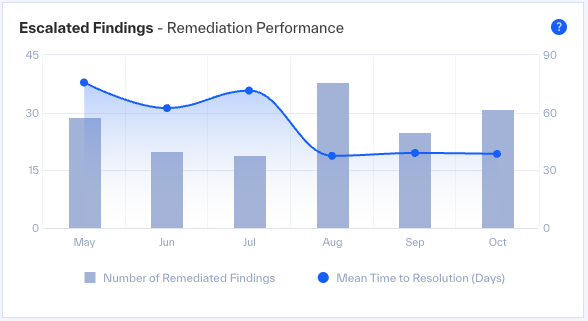 |
This widget shows you by month: the total escalated findings, resolved escalated findings, and the mean time to remediation. The totals are calculated from the sum of escalated findings that were closed for a given month. The mean time to resolution for a given month is calculated from the average of tracked time to resolve all escalated findings that were closed for that month.
To learn more, see Escalated Findings – Remediation Performance in the Analyst Dashboard.
Qualitative Analysis
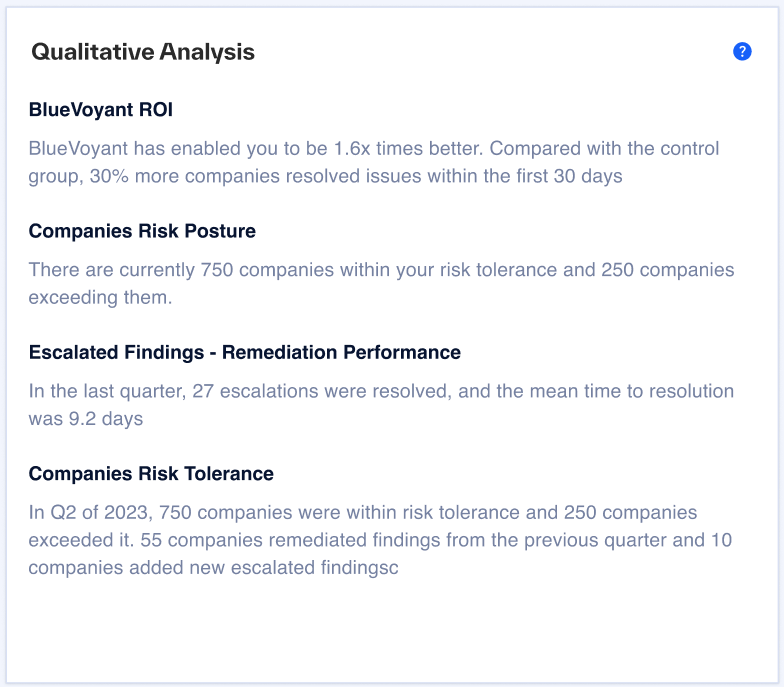 |
This widget shows an easy-to-read analysis of the other open Executive Dashboard widgets. This is for reports for personnel who may not use BlueVoyant TPRM regularly.